Dynamical Systems
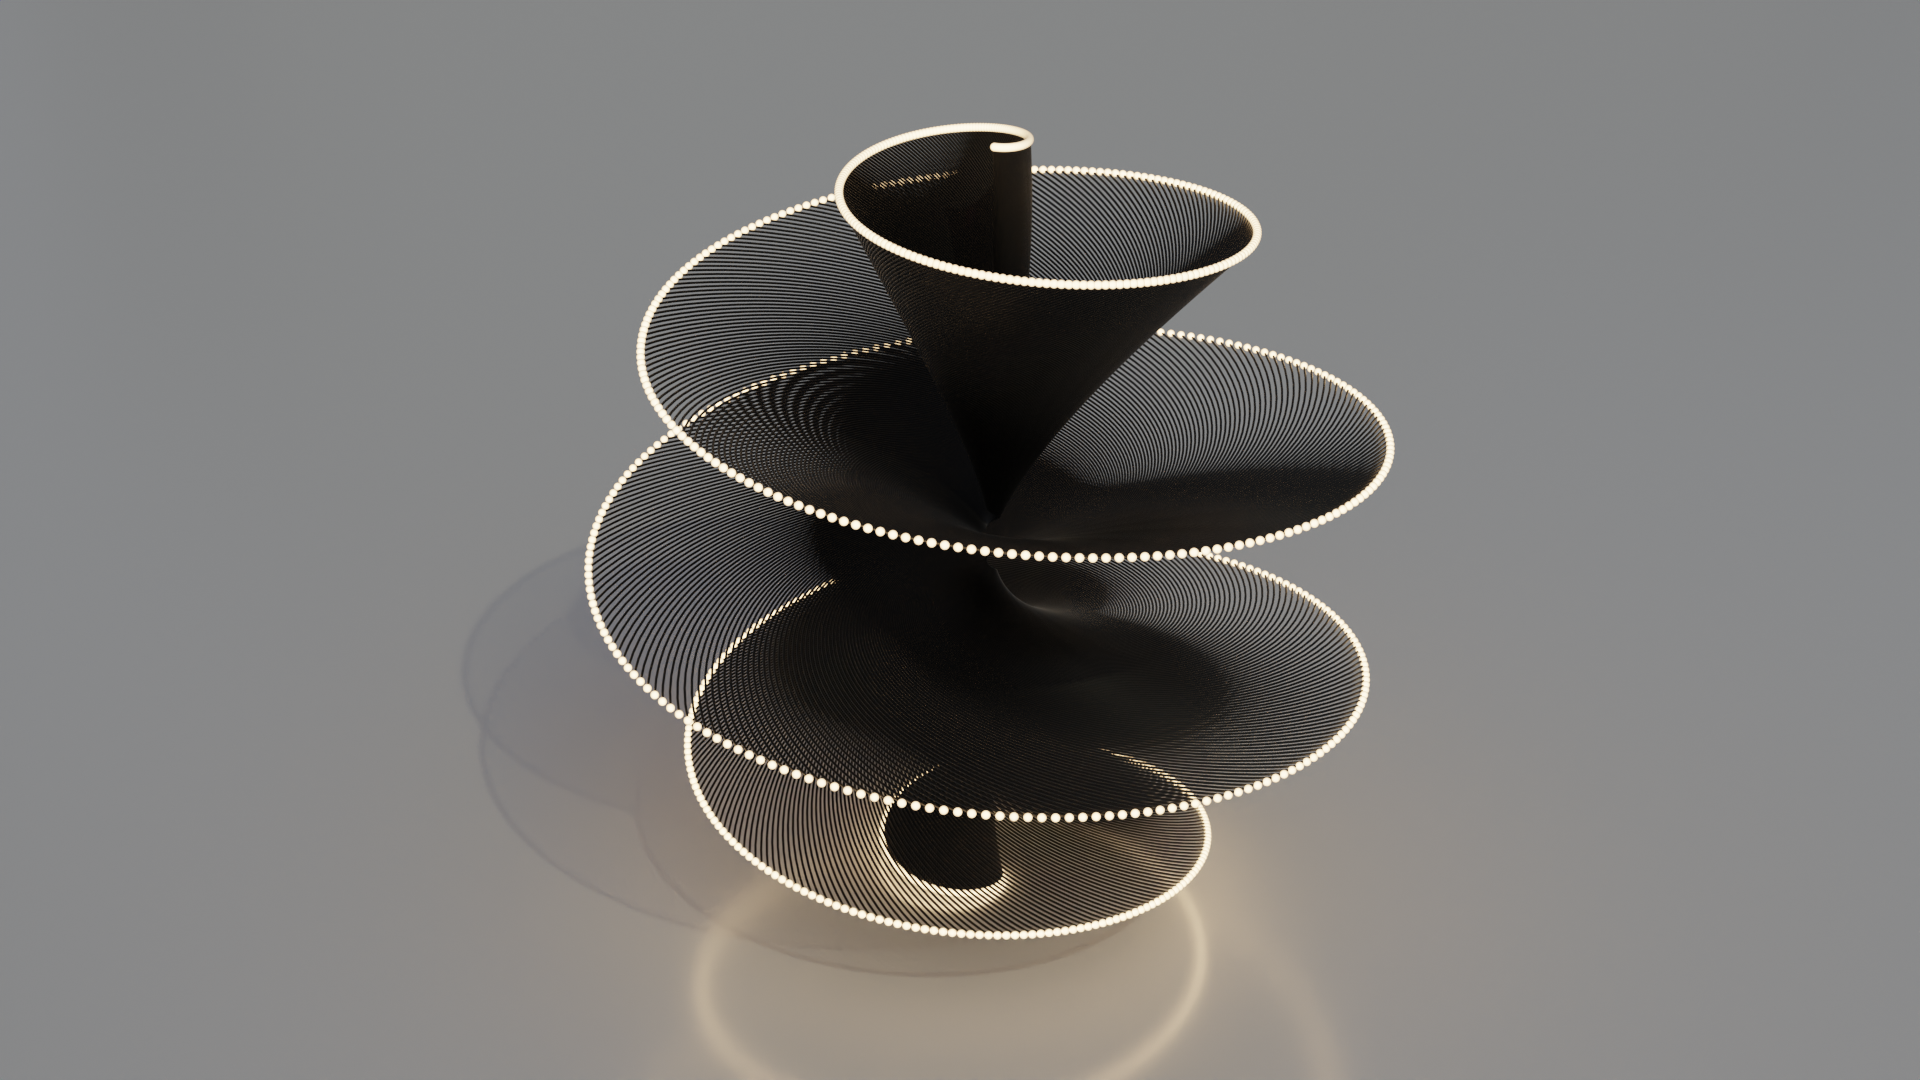
Trajectories (dark curves) in the vicinity of a stable focus-node for different arrangements of initial conditions (bright spheres).
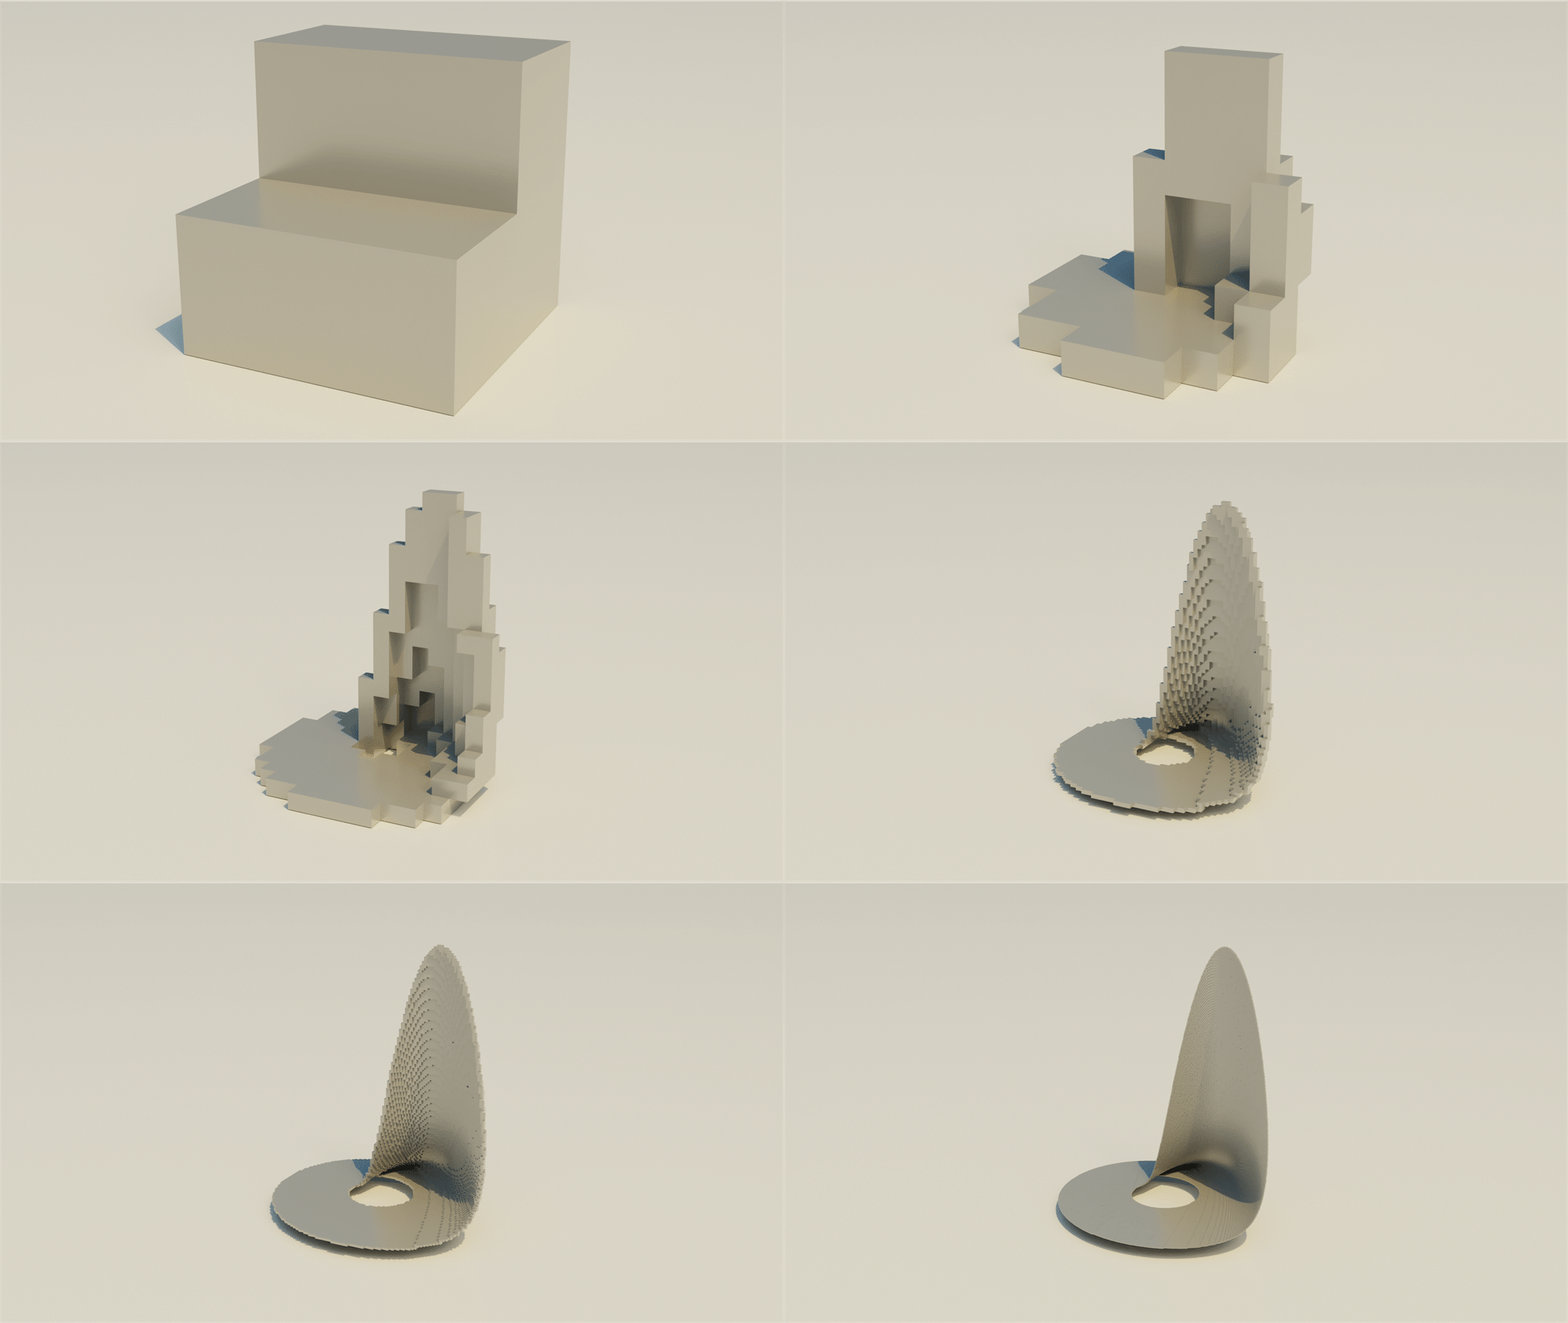
Approximating Rossler and Halvorsen attractors with a subdivision algorithm.
Real-time visualization of phase-space flows: Aizawa, Chen-Lee, Duffing-Holmes, Halvorsen, Lorenz, Lorenz-84, Rossler, Thomas and Three-Scroll Unified Chaotic System 2 (TSUCS2).
Waves
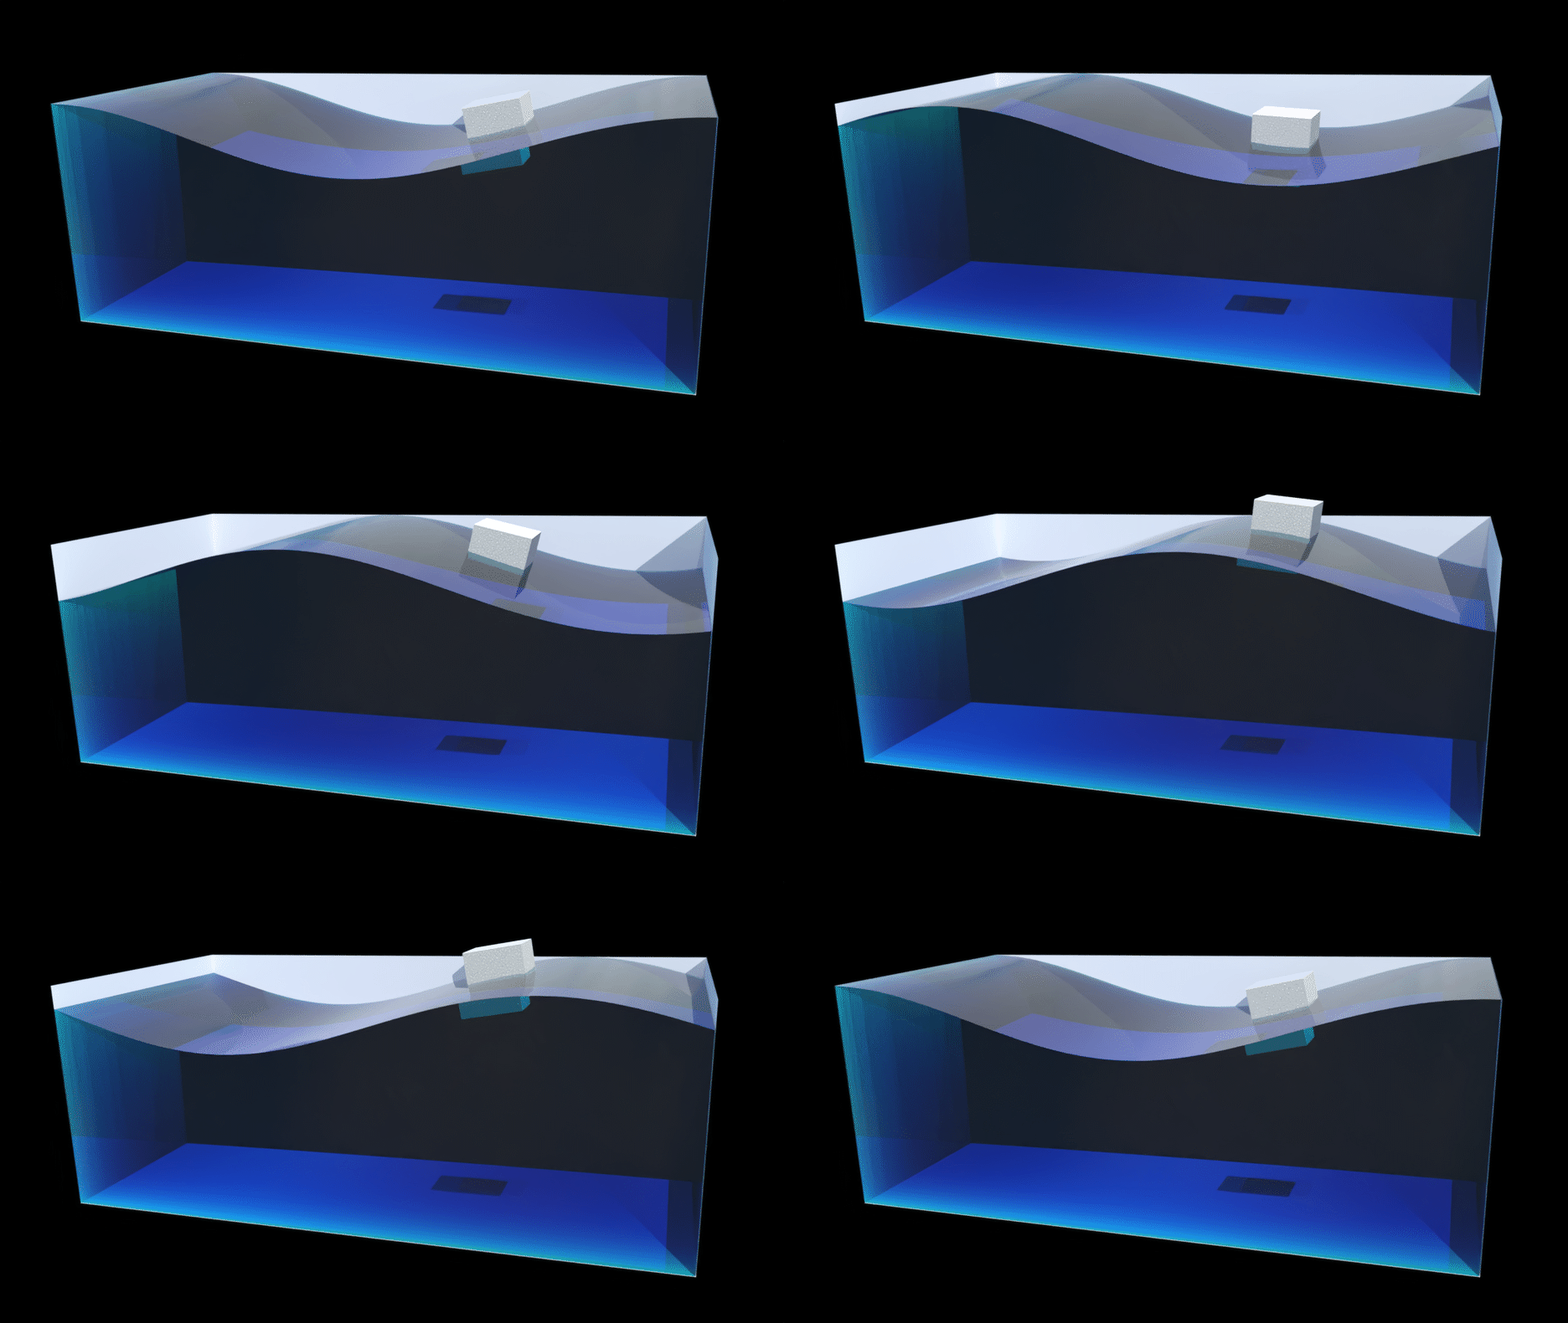
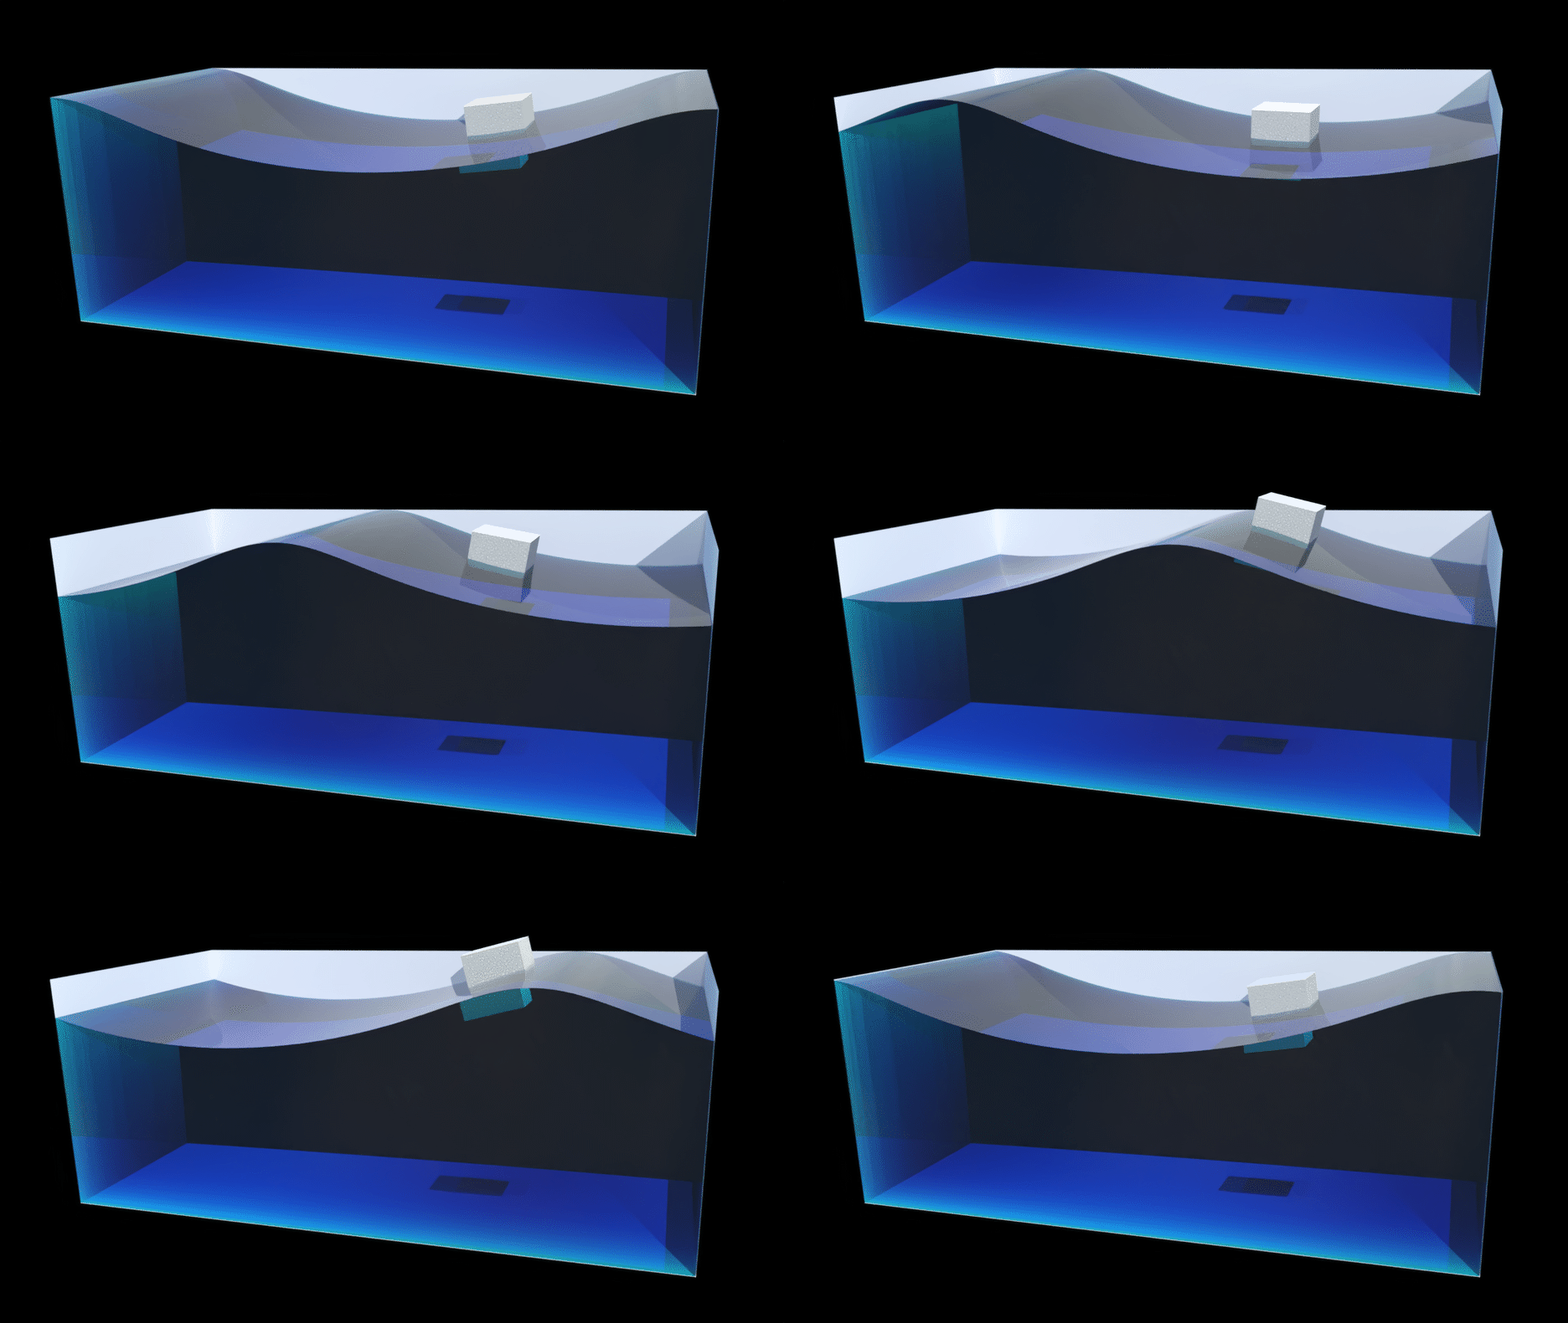
Linear, Stokes fifth- and Cnoidal third-order waves. The field is not altered by the presence of the cube; the latter is hydrostatically balanced at each time instant.
Interactive, real-time rendering of multi-component–multi-directional waves (JONSWAP spectrum and double-sum method).
Simulation of waves over varying bathymetry—1D Boussinesq-type model.
Floating Prisms
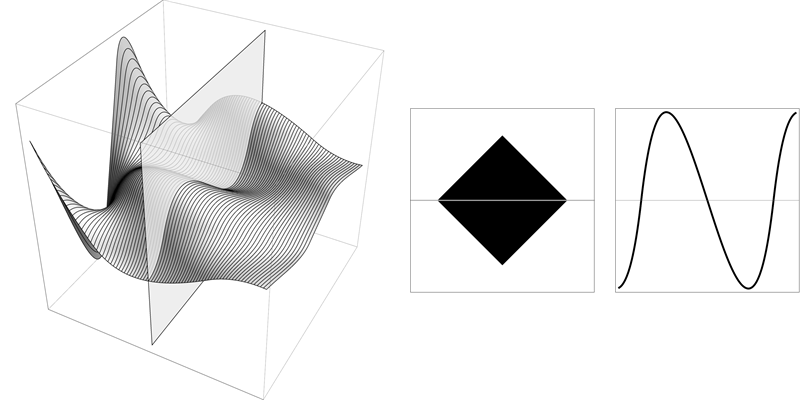
Hydrostatic calculations for a square prism. Left: Gz curves for a range of density ratio values (from 0.1 to 0.9; the vertical plane marks the selected value). Middle: The first stable equilibrium position calculated in the range [0, Pi]. Right: Gz curve in the range [-Pi/3, Pi/3] for the selected density ratio value.

Hydrostatic calculations for a semicylindrical prism. Left: Gz curves for a range of density ratio values (from 0.1 to 0.9; the vertical plane marks the selected value). Middle: The first stable equilibrium position calculated in the range [0, Pi]. Right: Gz curve in the range [-Pi/3, Pi/3] for the selected density ratio value.
Breadth/Draught Ratio 0.50

Hydrostatic calculations for a semielliptical prism; breadth to draught ratio 0.50. Left: Gz curves for a range of density ratio values (from 0.1 to 0.9; the vertical plane marks the selected value). Middle: The first stable equilibrium position calculated in the range [0, Pi]. Right: Gz curve in the range [-Pi, Pi] for the selected density ratio value.
Breadth/Draught Ratio 0.75

Hydrostatic calculations for a semielliptical prism; breadth to draught ratio 0.75. Left: Gz curves for a range of density ratio values (from 0.1 to 0.9; the vertical plane marks the selected value). Middle: The first stable equilibrium position calculated in the range [0, Pi]. Right: Gz curve in the range [-Pi/2, Pi/2] for the selected density ratio value.
Breadth/Draught Ratio 1.00

Hydrostatic calculations for a triangular prism; breadth to draught ratio 1.00. Left: Gz curves for a range of density ratio values (from 0.1 to 0.9; the vertical plane marks the selected value). Middle: The first stable equilibrium position calculated in the range [0, Pi]. Right: Gz curve in the range [-3Pi/4, 3Pi/4] for the selected density ratio value.


